
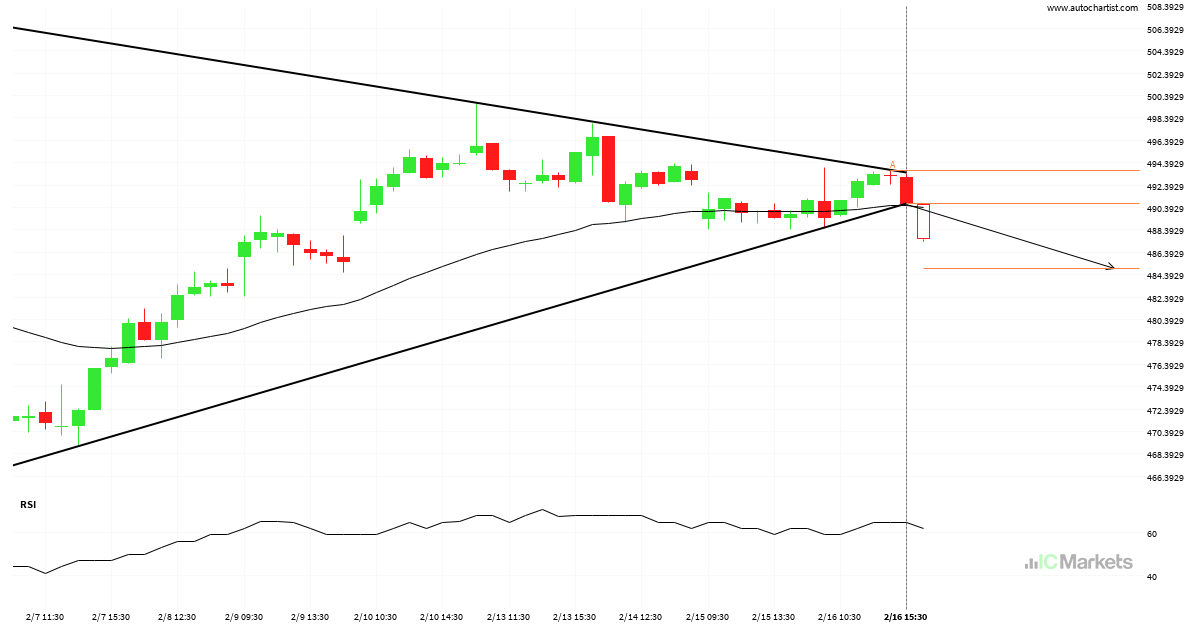
Unitedhealth Group Inc. has broken through support
Unitedhealth Group Inc. has broken through a support line. It has touched this line at least twice in the last 17 days. This breakout may indicate a potential move to 484.9572 within the next 15 hours. Because we have seen it retrace from this position in the past, one should wait for confirmation of the […]
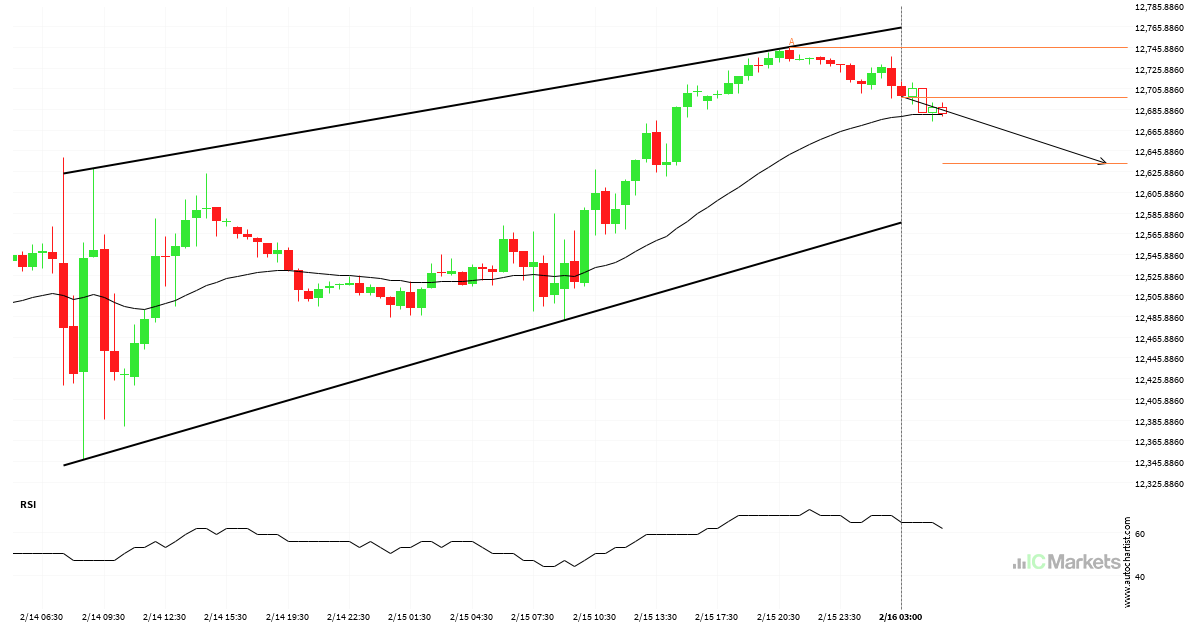
Either a rebound or a breakout imminent on US Tech 100 Index
US Tech 100 Index is heading towards the support line of a Canal ascendente. If this movement continues, the price of US Tech 100 Index could test 12634.1702 within the next 11 hours. It has tested this line numerous times in the past, so this movement could be short-lived and end up rebounding just like […]
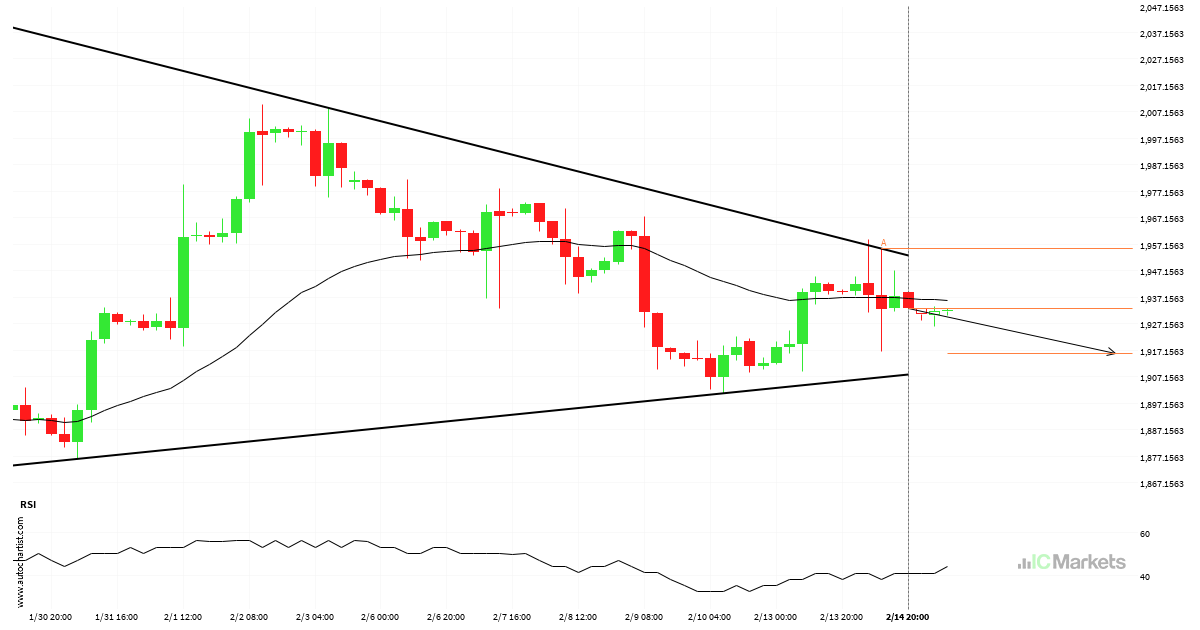
Either a rebound or a breakout imminent on US Small Cap 2000 Index
US Small Cap 2000 Index is heading towards the support line of a Triângulo. If this movement continues, the price of US Small Cap 2000 Index could test 1915.9221 within the next 3 days. It has tested this line numerous times in the past, so this movement could be short-lived and end up rebounding just […]
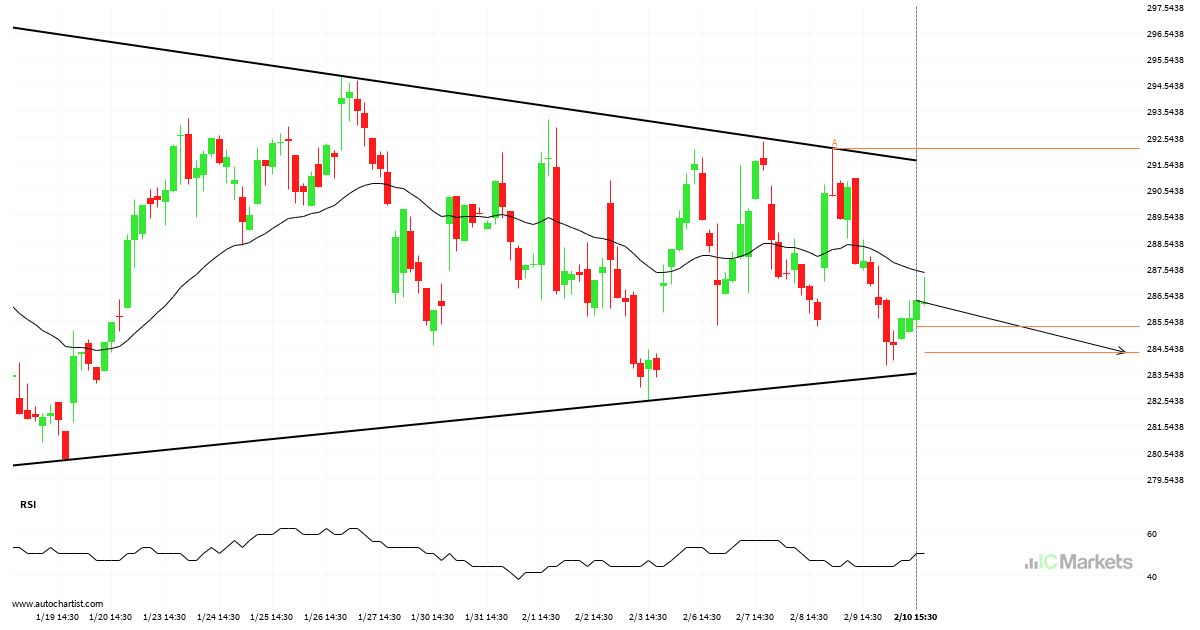
Biogen Idec Inc approaching support of a Triângulo
Biogen Idec Inc is approaching the support line of a Triângulo. It has touched this line numerous times in the last 36 days. If it tests this line again, it should do so in the next 2 days.
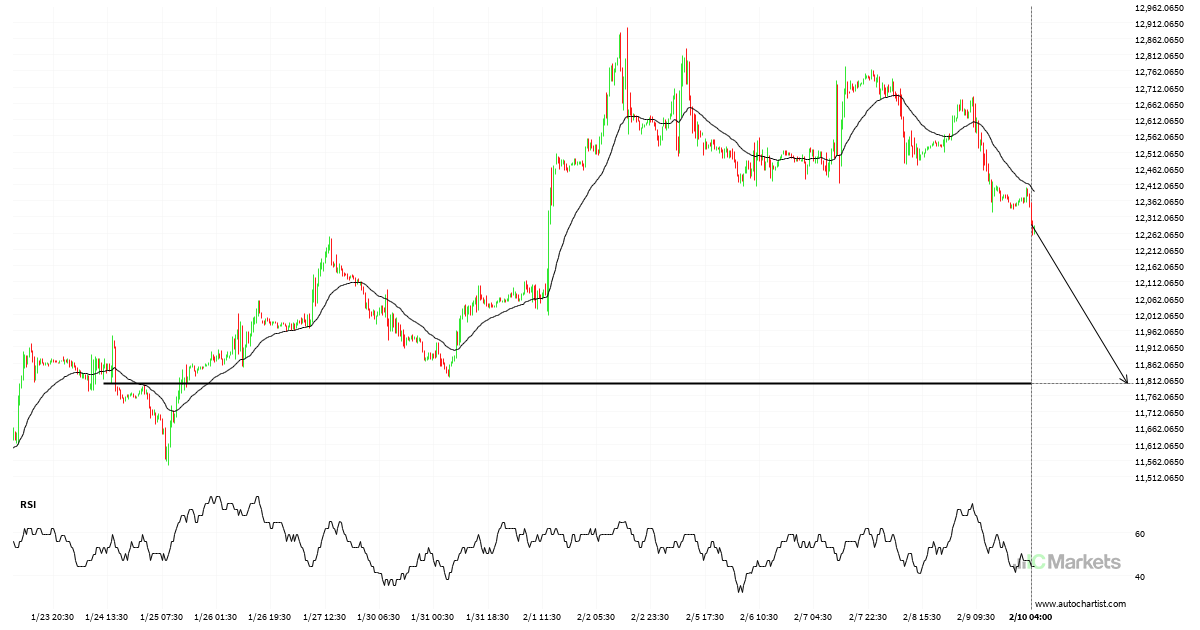
Either a rebound or a breakout imminent on US Tech 100 Index
US Tech 100 Index is heading towards a line of 11798.2998. If this movement continues, the price of US Tech 100 Index could test 11798.2998 within the next 3 days. But don’t be so quick to trade, it has tested this line numerous times in the past, so this movement could be short-lived and end […]
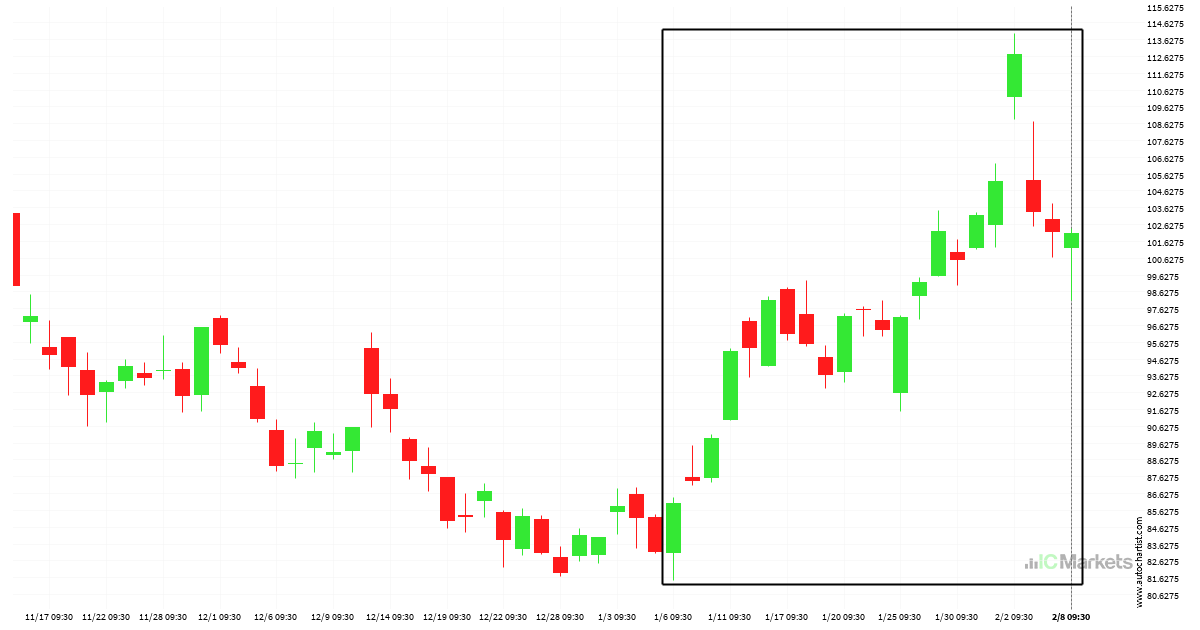
What’s going on with Amazon.Com Inc.?
Those of you that are trend followers are probably eagerly watching Amazon.Com Inc. to see if its latest 18,66% move continues. If not, the mean-reversion people out there will be delighted with this exceptionally large 34 days move.
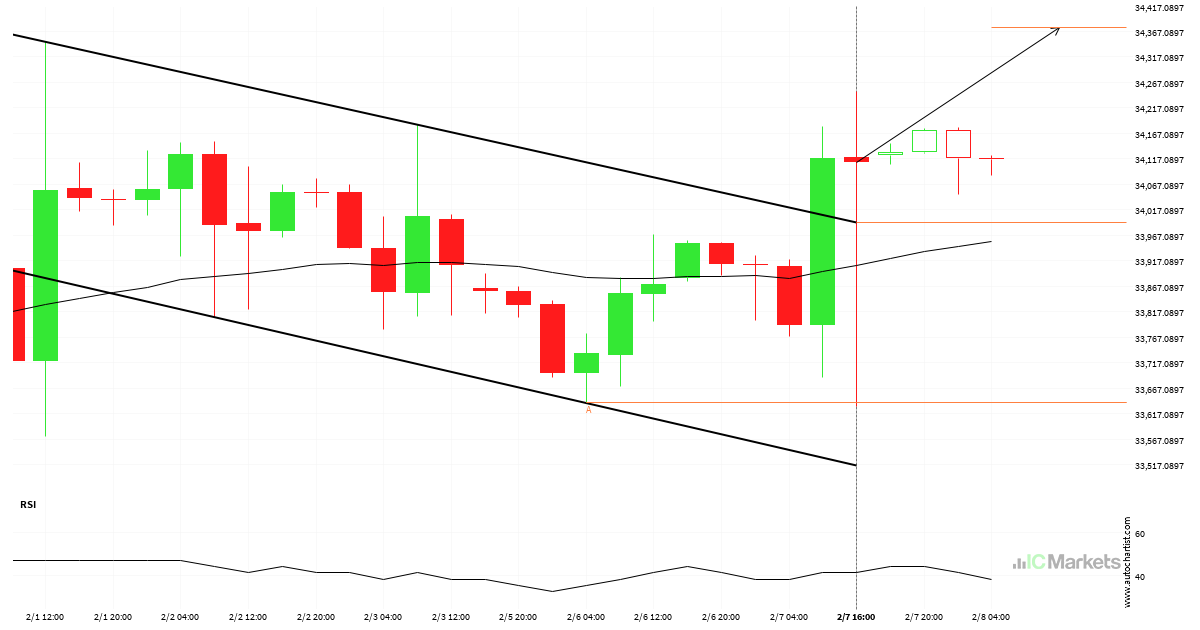
US Wall Street 30 Index has broken through resistance
US Wall Street 30 Index has broken through a resistance line. It has touched this line at least twice in the last 7 days. This breakout may indicate a potential move to 34374.1923 within the next 15 hours. Because we have seen it retrace from this position in the past, one should wait for confirmation […]
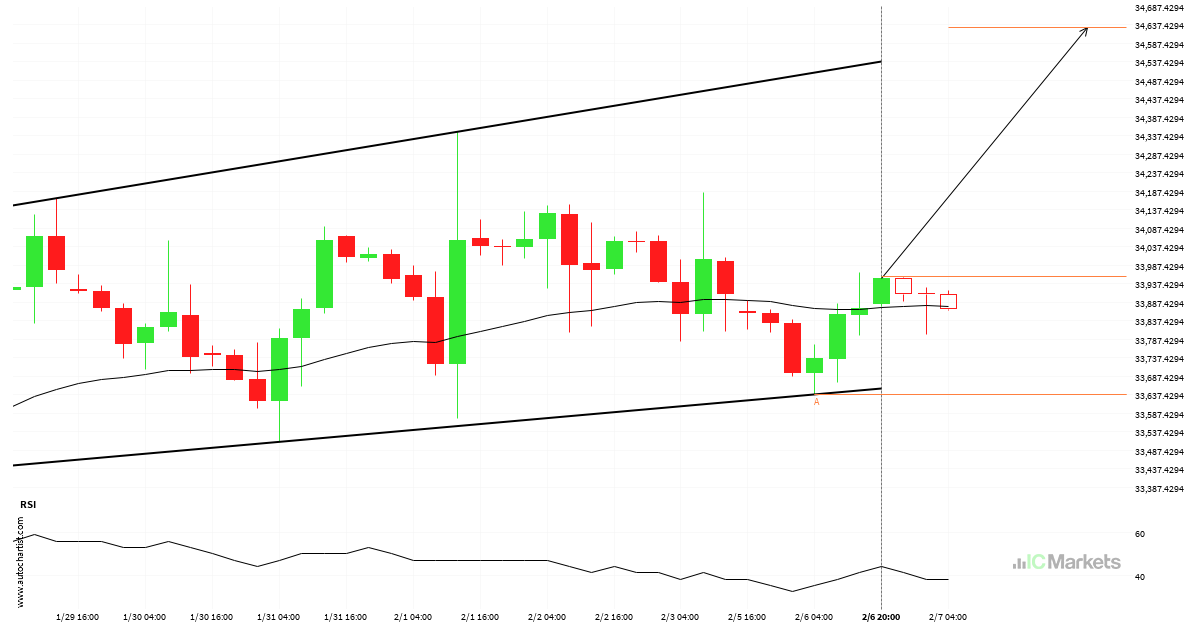
US Wall Street 30 Index approaching resistance of a Canal ascendente
US Wall Street 30 Index is approaching the resistance line of a Canal ascendente. It has touched this line numerous times in the last 18 days. If it tests this line again, it should do so in the next 2 days.
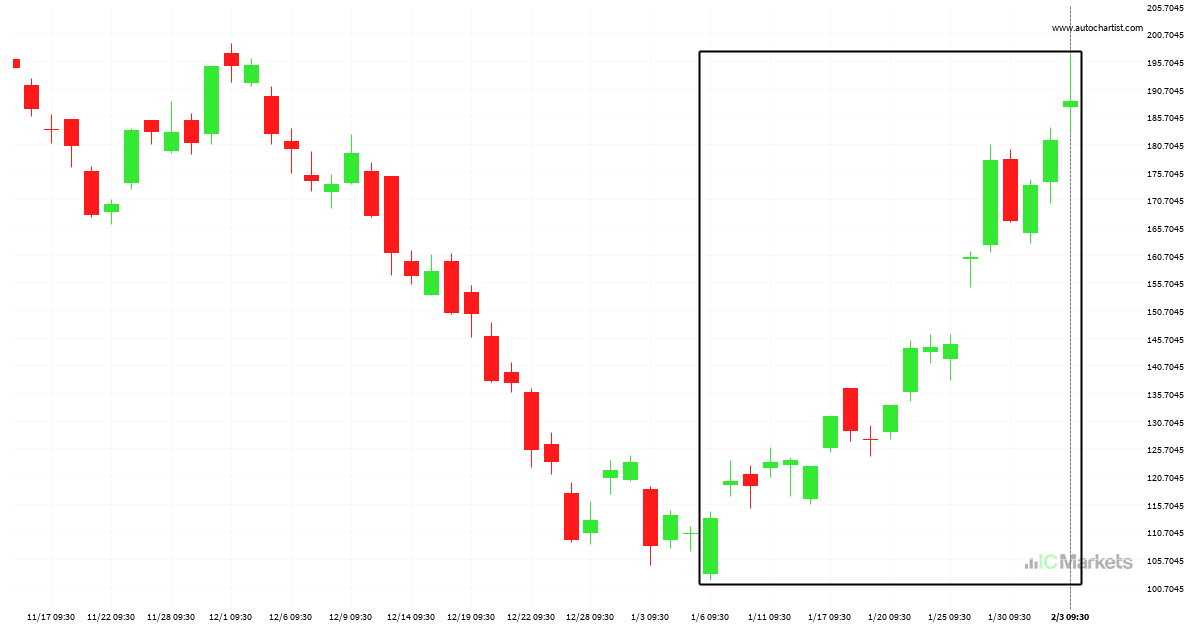
Tesla Inc. is on its way up
Tesla Inc. has experienced an exceptionally large movement higher by 66,72% from 113.01 to 188.41 in the last 29 days.
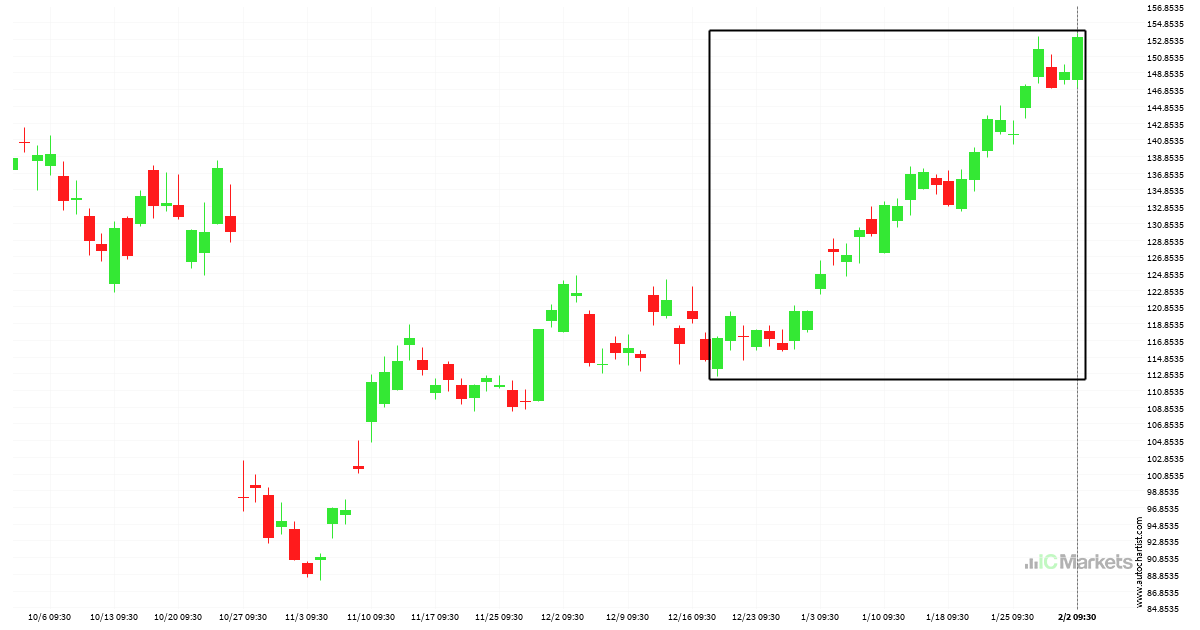
Meta Platforms, Inc. – Class A Common Stock is on its way up
Meta Platforms, Inc. – Class A Common Stock has experienced an exceptionally large movement higher by 30,76% from 117.07 to 153.08 in the last 45 days.